Hat jemand zufällig eine Idee, wie ich am besten die CGIs von VM im management Interface analysieren und "zusammenschneiden" kann?
Um alle virtuellen guests zu überwachen muss ich ja auf jedem GSX server mal kurz schauen, welche on oder offline sind. da das ganze über skripte läuft, ich aber nicht weiss woher die infos kommen, wäre es super, wenn man ein skript bei sich aufruft, das dann alle gsx server nachfragt, welche maschinen auf denen on oder offline sind.
Oder vielleicht hat das jemand schon versucht?
Die Foren-SW läuft ohne erkennbare Probleme. Sollte doch etwas nicht funktionieren, bitte gerne hier jederzeit melden und wir kümmern uns zeitnah darum. Danke!
GSX und Perl, ein Virtual Center zum selber bauen
hi
die scripting API kann das
die musst du allerdings seperat installieren
so ungefähr könnte das ausschaun
dann bekommst du zurück ob on oder off
mehrere server sollten dank unc pfaden auch kein problem sein
hth
lg gsx²
die scripting API kann das
die musst du allerdings seperat installieren
Code: Alles auswählen
vmware-cmd "c:\yourpath\yourconfig.vmx" getstateso ungefähr könnte das ausschaun
dann bekommst du zurück ob on oder off
mehrere server sollten dank unc pfaden auch kein problem sein
hth
lg gsx²
- continuum
- UNSTERBLICH(R.I.P.)
- Beiträge: 14759
- Registriert: 09.08.2003, 05:41
- Wohnort: sauerland
- Kontaktdaten:
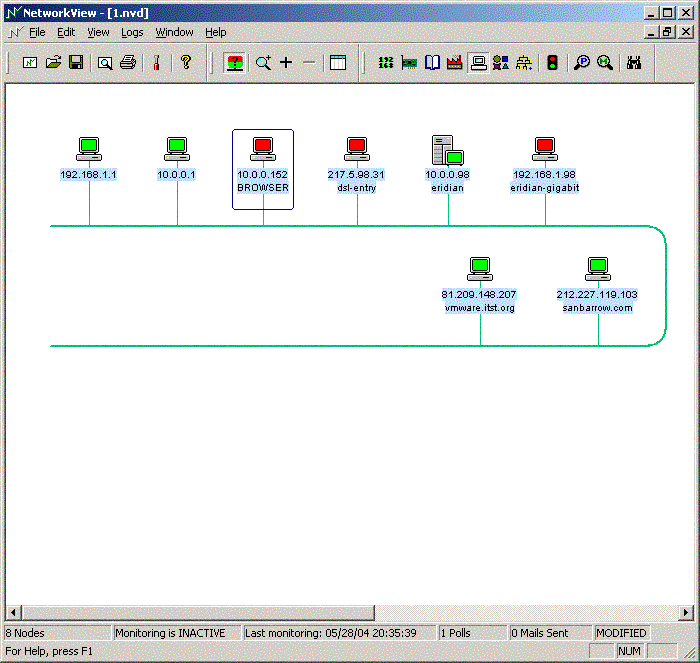
Eine schlanke Version ist vielleicht auch ganz interessant:

Ueber Kontextmenue kann man verschiedene Protokolle aufrufen um genaueres zu erfahren.
Das Programm passt auf eine Floppy - es lassen sich verschiedene Maps speichern - die Abfrage kann ueber TCP/IP oder MAC oder DNS geschehen. Portscanner ist eingebaut ....
Das ist zwar etwas anderes als der GSX/ESX Status - wenn es darauf ankommt ob die einzelnen VMs ihre Arbeit tun und erreichbar sind hat man doch hiervon mehr - oder?
Und mann kann halt auch noch abfragen lassen ob die Geliebte wieder am Chatten ist.
http://www.networkview.com/
Addresses Scan
Three types of discovery : single address, range of addresses, full subnet. Checkboxes to use DNS, SNMP and/or TCP Ports. Customizable retries and timeouts. ICMP not required to discover behind firewalls. Maps can also be updated using either DNS name or IP address as the permanent identifier. Detailed discovery log.
MAC Addresses
If you are using NetworkView on a LAN, it will get all MAC addresses from your local ARP table, then will retrieve the NIC manufacturer by comparing the OUI (Organizationally Unique Identifier) with the information in its database (more than 5000 records).
Nodes types
Each network node is classified as one of the built-in type and icon: Server, Workstation, Unix station, Router, Printer, ... There are currently 19 types available. A type can be associated with each entry in the OID and MAC Addresses Databases.
Nodes editing
Manual addition of nodes : you can add one or x nodes manually, and edit them as you like. Routes can also be added manually on devices in case you do not have the correct community name. Almost unlimited text can be entered as a note for each node.
SNMP
A complete database containing more than 5000 enterprise and device sysObjectIDs. Fully editable, with add, delete or modify capabilities. Import from text files (.csv delimited format) if you have your own lists. An internal hard coded list of the most frequent devices found in networks.
Route discovery
A graphic box is displayed for each node acting as a router, showing the addresses of the connected networks. You can add any text next to the IP information (building, city, country..) to describe the destination.
Port analysis
NetworkView analyses five standard ports (FTP, TELNET, SMTP, HTTP, POP3) to try to get information about the nodes. You can specify three additional custom ports that could be meaningful to you (IMAP4 143, HTTPS 443, Quote 17...?)
Port scan
NetworkView has two full TCP port scanners: one for discovery time and another available as a "right click" contextual tool. You can specify any range of ports (For example: 20-25, 80, 110, 199-125).
Sorting
In each view, nodes can be sorted by TCP/IP address, MAC Address, DNS name, sysObjectID, Type, Enterprise/Device, sysName, or real time monitoring status. Use the Find button to locate nodes in the map by name or IP address.
Monitoring
Status
Simultaneous monitoring of several networks with ICMP polling. Four states : UP (green), DOWN (red), UNKNOWN (blue) and NOT MONITORED (white).
Logs
Two history log views available for monitoring :
- UP and DOWN events
- Copy of all alert emails.
Autostart
Launch the monitoring process on your network automatically at server boot.
Alerts
SMTP
You can choose to send SMTP emails to one or several addresses when nodes become unreachable. You also choose how many emails you want to receive (between 1 and infinite) and get a final email when the nodes come up again. The emails contains 3 category: Node just DOWN, ALREADY DOWN and UP AGAIN.
Sound
Be warned of UP and DOWN events with chosen .wav files, or little built-in music and beeps.
External Utilities
Use any external utility (net send, pager..) to send alerts. Two modes: an alert for each event or a network summary.
MIB Browser
Mib Browser
A Mib Browser lets you get/set any value from your MIB2 or proprietary MIBs. You can export the result to the clipboard or a text file. Ten favorite OIDs can be saved for future use. Symbolic names are supported.
Miscellaneous
Preferences
A lot of parameters can be customized: general discovery behavior, network and color options, size and number of the nodes in the map, email and sound alerts, color or BW printing, custom ports, custom contextual menus and many other.
Reports
Four types of reports available : a list of nodes with notes texts, a list of collected SNMP information, a list of addresses and routes on each device and a list of TCP Ports information. Print and print preview with column customization available.
Export map as EMF
You can save a complete map as a EMF (Enhanced MetaFile). This is a vectorial type file that will allow you to modify the sizes, colors and shapes of every items with an external graphic application (Designer, Paint Shop Pro, Visio).
Custom menus
You can customize the menus for each node by adding 3 of your favorite applications, and pass them the IP address or DNS name of the current node. For example, VNC, Telnet on port 25, external Telnet application.
Printing
Full print and print preview capabilities for views and reports, producing high quality network color maps in seconds ! Choose the number of nodes you want on a single sheet : between 10 and 300.
User interface
Multiple Document Interface let you view and/or monitor several networks at the same time. Each view is simply a container that can hold any node form any subnet. For example a node 192.168.10.1 can be in the same view as 10.1.1.1
Requirements
Operating System
Windows XP, Windows NT 4.0 Server or Workstation, Windows 2000 Professional, Server or Advanced Server, Windows ME, 98 (Windows 95 not supported). On NT/2000/XP, you must have administrator rights to use discovery and monitoring. SNMP management API is not provided on Win98 and ME.
Floppy usage
The program, including the complete SNMP and MAC addresses databases, can be used from a floppy. You even get enough space to store information for a few hundred nodes.
Code and Database
Standalone multi-threaded 32 bits C++ program. No external DLLs. Complete fast database code included. No external DAO, OLE DB, ADO, ODBC (or else...) needed.
Zurück zu „VMserver 1 und GSX“
Wer ist online?
Mitglieder in diesem Forum: 0 Mitglieder und 1 Gast
